Aggregated Data Services Overview
Candle types
This document presents information about different types of aggregations provided by dxFeed Aggregated Data Services. In the sections below you can find the overall description of aggregates, possible configuration parameters and examples.
Candle type | By time | By price movement | Other | What parameters should be added? | Description |
|---|---|---|---|---|---|
Time-based candles | + | Define the time period which should be used for ticks aggregation: =12s | A graph where every candle includes ticks from the pre-defined time interval. In general, traders may use it to define possible price movements based on earlier patterns | ||
Tick-based candles | Number of ticks | Define number of ticks to be included in the candle: =10t | A graph where every candle has a pre-defined number of ticks. The graph can be used by traders to see how volatile the market was | ||
Volume-based candles | Volume of ticks | Define volume to be included in the candle: =100v | A graph where every candle has a pre-defined volume. The graph can help to identify more precise patterns in the price movement as opposed to time-based candles | ||
Price-based candles | + | Define the price change: =0.1p | The graph helps users to smooth the insignificant price changes and identify the trend more clearly because a new candle will be built only after the defined price movement happens. The difference with Renko candles is that Price-based candles are accumulated based on individual ticks. Renko candles are built based on close prices of minute candles | ||
Price Level candles (market by price candles) | + | + | Define the aggregate and the prices level to split the aggregate: =m, pl =0.1 | A graph where the pre-defined aggregate is split into the defined price slices. It can be imagined as a time-based candles where every candle is used to build price-based candles. This data presentation helps to see on which price level the maximum liquidity was accumulated inside the fixed time interval | |
Price Momentum candles | + | Define the price change: =0.1pm | The graph allows to see the smoothed price movements and identify trends. It is more comprehensive as opposed to price-based candles because it takes into account not only price change but also the possible tick size of the instrument that makes it more close to the possible price movements on the market | ||
Renko candles | Partially | + | Define the size of the Renko box: =0.1pr | A Renko candle is formed only if the closing prices on the chosen chart time frame moves at the pre-defined value (box size). It does not rely on time, so any candle can include price points from random time intervals. In general, every new block is positioned at a 45-degree angle (up or down) to the prior block. Renko charts are designed to filter out minor price movements to make it easier for traders to focus on important trends | |
Option expiration candles | Partially | Define option specific aggregation and how many intervals to include (3 in the example below): =3o | The graph helps to analyze the option price trends which can be noticed when one option is rolling to the other. Options prices are aggregated in the time intervals according to the type of option itself, so you do not need to care about the selection of the proper time interval: for weekly options - the aggregate will be a week, for standard options - starting from the 3rd Friday of the previous month to the 3rd Friday in the current month, etc | ||
Formula-based candles | + | Define the time period which should be used for ticks aggregation: =1m | A graph where every candle includes ticks from the pre-defined time interval. Ticks from multiple symbols can be combined according to user-defined formulas. The formulas support basic math operations |
Historical candle data availability
Depth available by default (both limits listed in the table apply to data sets, counting backward from the current time):
Aggregations | Depth available (calendar days) | Maximum number of candles at a time |
|---|---|---|
1 tick | 5 days | 1000 |
2+ ticks | 5 days | 8000 |
1+ seconds | 5 days | 8000 |
1 - 4 minutes | 43 days | 8000 |
5+ minutes | 90 days | 8000 |
1+ hour | 285 days | 8000 |
Days, weeks, months | All available period | 8000 |
Price | 5 days | 8000 |
Price level | 5 days | 8000 |
Volume | 5 days | 8000 |
Renko | 120 days | 1000 |
Other aggregates | 2 days | 8000 |
Parameters that are applicable for all types of candles
To define the price type to be used for aggregation in 12 seconds candles, set the corresponding parameters:
bid price →
AAPL{=12s,price=bid}ask price →
AAPL{=12s,price=ask}mark price →
AAPL{=12s,price=mark}
To align the start of the candle with the start of the regular trading session, set the alignment parameter:
AAPL{=12s,a=s}→ the candle will start at 9:30AAPL{=12s}→ the candle will start at 9:00
To aggregate only information from a regular trading session, set the trading session parameter:
AAPL{=12s,tho=true}→ only candles from regular trading session are shown
Time-based candles
To define the time period, set the corresponding parameters:
2 years →
AAPL{=2y}5 months →
AAPL{=5mo}5 days →
AAPL{=5d}3 weeks →
AAPL{=3w}7 hours →
AAPL{=7h}23 minutes →
AAPL{=23m}12 seconds →
AAPL{=12s}
Tick-based candles
To receive Tick candles, specify the number of ticks of the symbol to be included in every candle. For example, AAPL{=10t} will return candles with exact 10 ticks of AAPL each.
Example
If input ticks are:
Time | Volume | Price |
|---|---|---|
20191224 - 100130-500 | 1 | 56.5 |
20191224 - 100233-500 | 2 | 56.55 |
20191224 - 101020-500 | 1 | 56.65 |
20191224 - 120125-500 | 2 | 56.52 |
Then Tick candles with 3 ticks each are:
Time | Count | Volume | Open | High | Low | Close |
|---|---|---|---|---|---|---|
20191224 - 100130-500 | 3 | 4 | 56.5 | 56.65 | 56.5 | 56.65 |
20191224 - 120125-500 | 1 | 2 | 56.52 | 56.52 | 56.52 | 56.52 |
Volume-based candles
To receive Volume candles, specify the volume to be aggregated in every candle. For example, AAPL{=10v} will return candles with exact 10 AAPL stocks each.
Info
The same tick can be included into 2 different candles in case its volume can not fit in 1 candle.
Example
If input ticks are:
Candle | EventSymbol | EventTime | Time | Sequence | Count | Open | High | Low | Close | Volume |
|---|---|---|---|---|---|---|---|---|---|---|
Candle | AAPL | 20200106-040059.645-0500 | 20200106-040059-0500 | 645:74 | 1 | 294.2 | 294.2 | 294.2 | 294.2 | 200 |
Candle | AAPL | 20200106-040108.045-0500 | 20200106-040108-0500 | 45:83 | 1 | 294.2 | 294.2 | 294.2 | 294.2 | 183 |
Candle | AAPL | 20200106-040200.774-0500 | 20200106-040200-0500 | 774:111 | 1 | 294.78 | 294.78 | 294.78 | 294.78 | 200 |
Candle | AAPL | 20200106-040213.373-0500 | 20200106-040213-0500 | 373:119 | 1 | 294.77 | 294.77 | 294.77 | 294.77 | 100 |
Candle | AAPL | 20200106-040531.686-0500 | 20200106-040531-0500 | 686:182 | 1 | 294.77 | 294.77 | 294.77 | 294.77 | 100 |
Candle | AAPL | 20200106-040531.942-0500 | 20200106-040531-0500 | 942:184 | 1 | 294.77 | 294.77 | 294.77 | 294.77 | 100 |
Candle | AAPL | 20200106-040552.206-0500 | 20200106-040552-0500 | 206:186 | 1 | 294.95 | 294.95 | 294.95 | 294.95 | 100 |
Candle | AAPL | 20200106-040552.206-0500 | 20200106-040552-0500 | 206:188 | 1 | 294.95 | 294.95 | 294.95 | 294.95 | 200 |
Candle | AAPL | 20200106-040620.628-0500 | 20200106-040620-0500 | 628:190 | 1 | 294.72 | 294.72 | 294.72 | 294.72 | 147 |
Candle | AAPL | 20200106-040621.029-0500 | 20200106-040621-0500 | 29:198 | 1 | 295 | 295 | 295 | 295 | 152 |
Candle | AAPL | 20200106-040626.228-0500 | 20200106-040626-0500 | 228:200 | 1 | 295 | 295 | 295 | 295 | 100 |
Candle | AAPL | 20200106-040626.593-0500 | 20200106-040626-0500 | 593:202 | 1 | 295 | 295 | 295 | 295 | 100 |
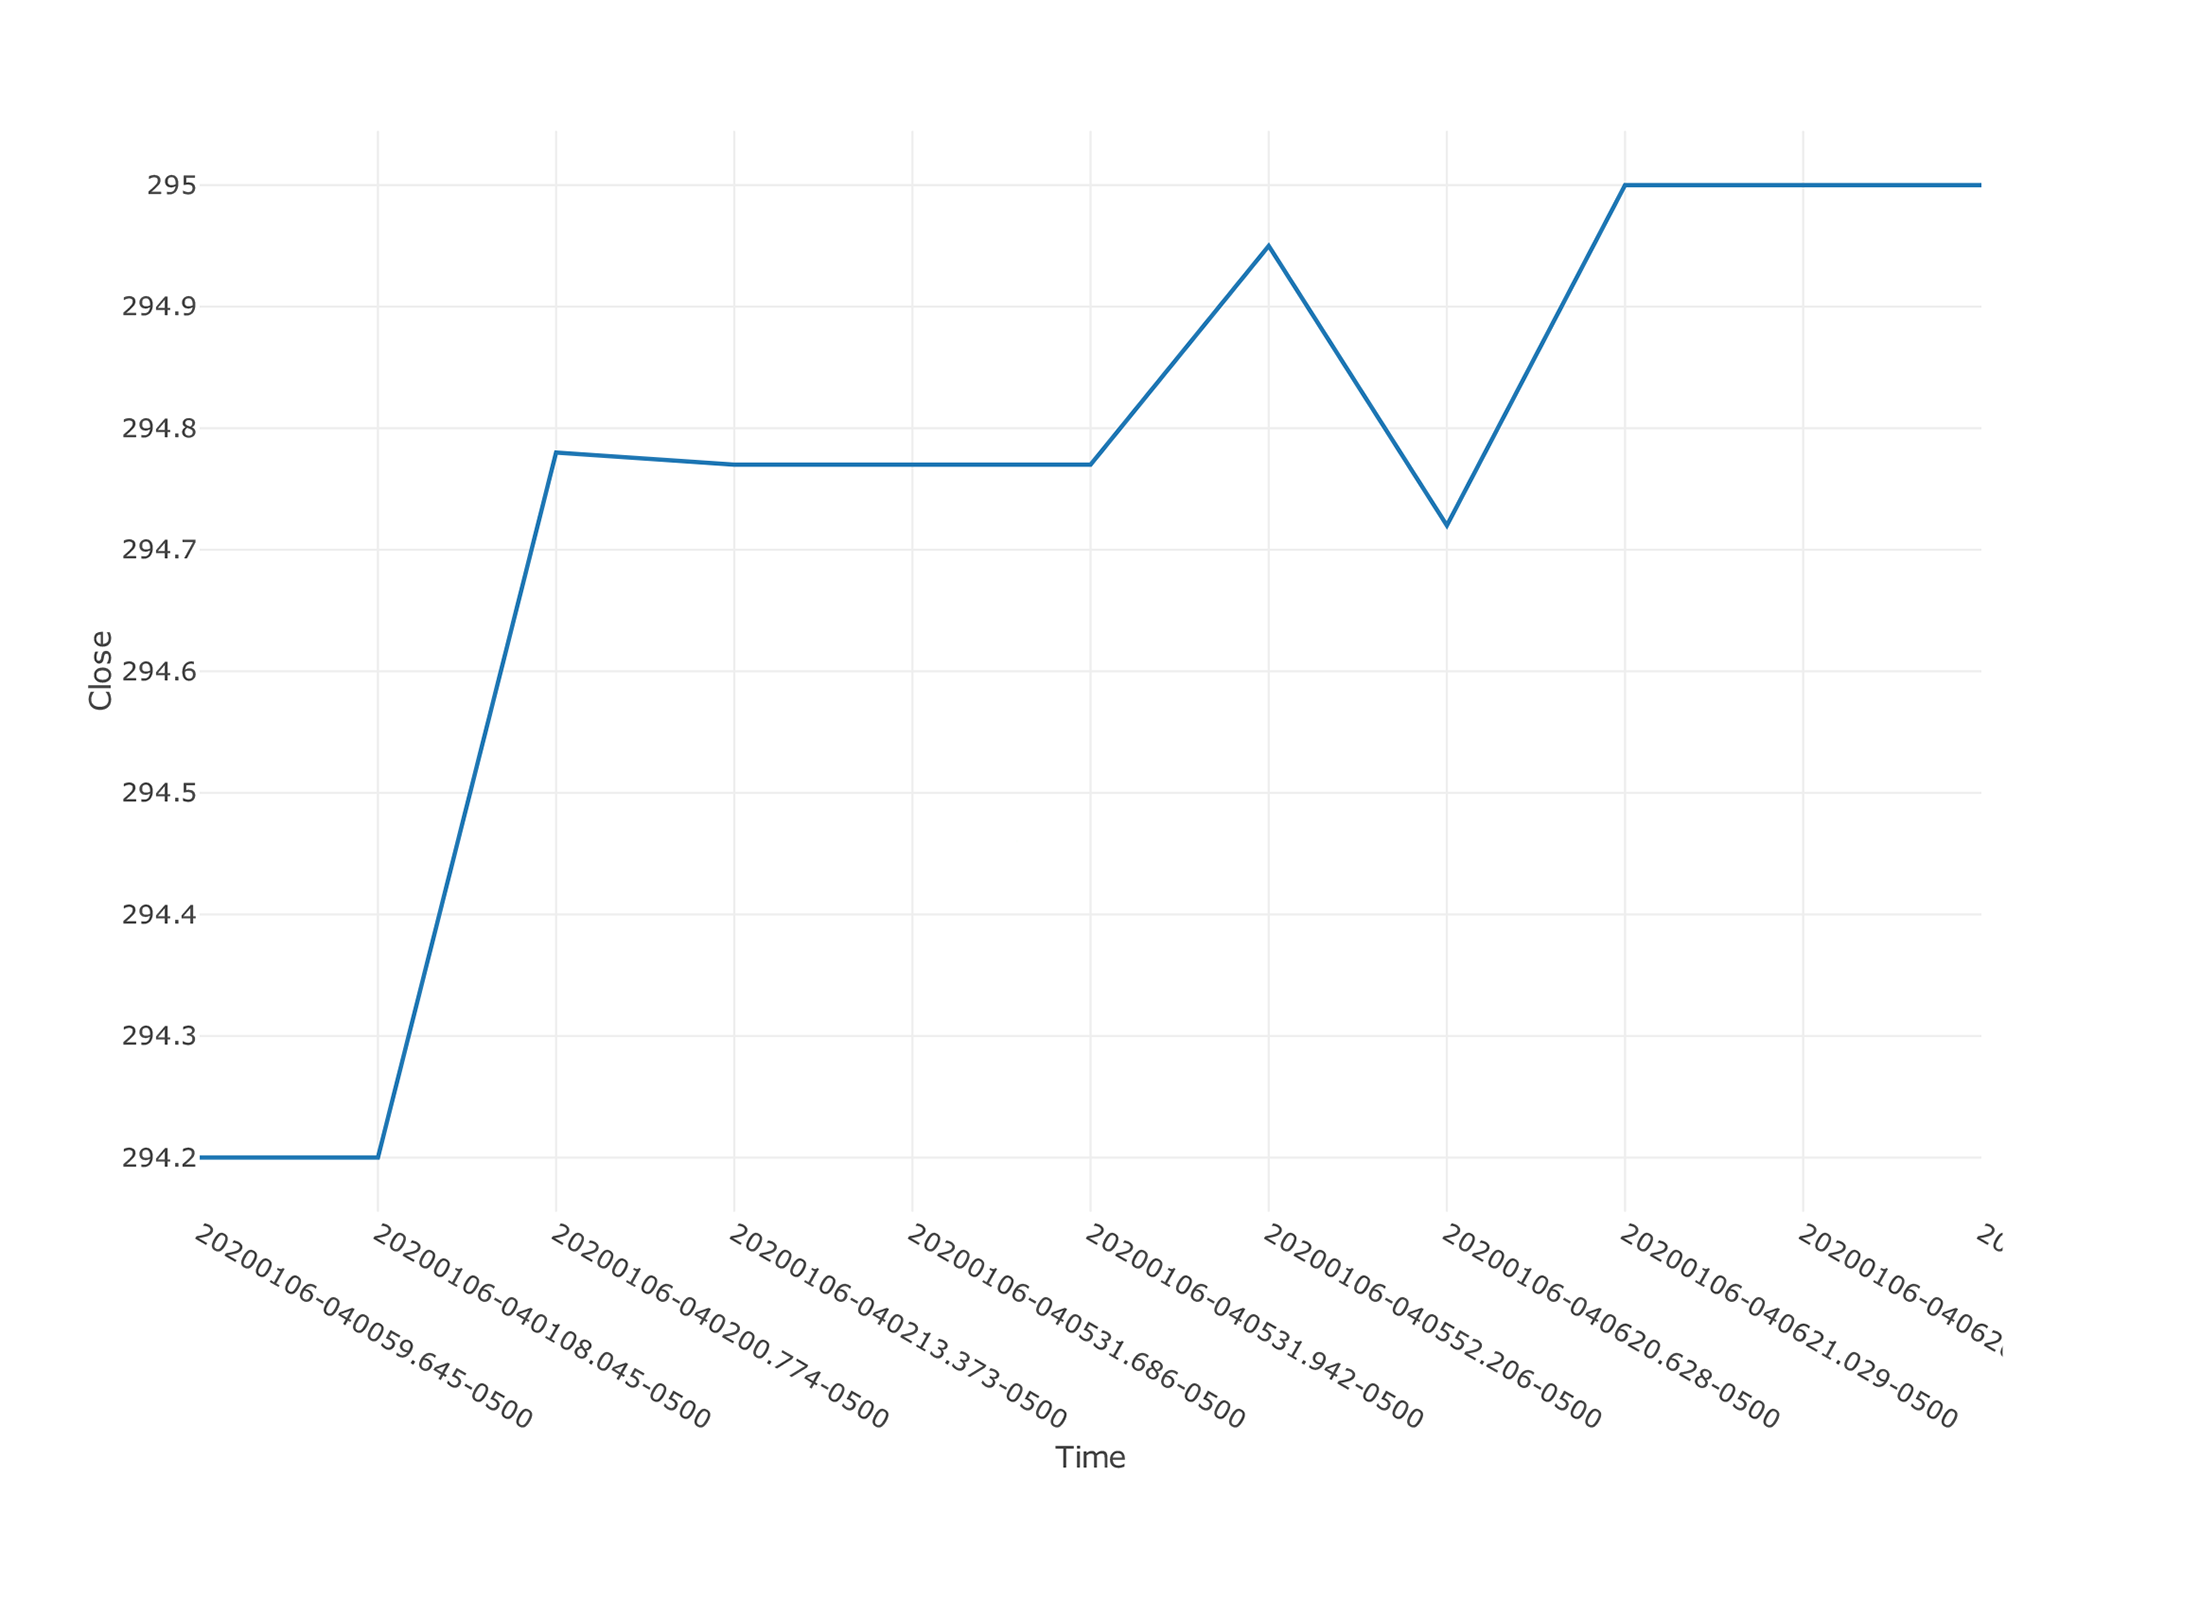 |
Then Volume candles with 300 stock volume are:
Candle | EventSymbol | EventTime | Time | Sequence | Count | Open | High | Low | Close | Volume |
|---|---|---|---|---|---|---|---|---|---|---|
Candle | AAPL{=300v} | 20200106-040059.645-0500 | 20200106-040059-0500 | 645:74 | 2 | 294.2 | 294.2 | 294.2 | 294.2 | 300 |
Candle | AAPL{=300v} | 20200106-040108.045-0500 | 20200106-040108-0500 | 45:83 | 3 | 294.2 | 294.78 | 294.2 | 294.77 | 300 |
Candle | AAPL{=300v} | 20200106-040213.373-0500 | 20200106-040213-0500 | 373:119 | 4 | 294.77 | 294.95 | 294.77 | 294.95 | 300 |
Candle | AAPL{=300v} | 20200106-040552.206-0500 | 20200106-040552-0500 | 206:186 | 3 | 294.95 | 294.95 | 294.72 | 294.72 | 300 |
Candle | AAPL{=300v} | 20200106-040620.628-0500 | 20200106-040620-0500 | 628:190 | 3 | 294.72 | 295 | 294.72 | 295 | 300 |
Candle | AAPL{=300v} | 20200106-040626.228-0500 | 20200106-040626-0500 | 228:200 | 3 | 295 | 295 | 294.86 | 294.86 | 300 |
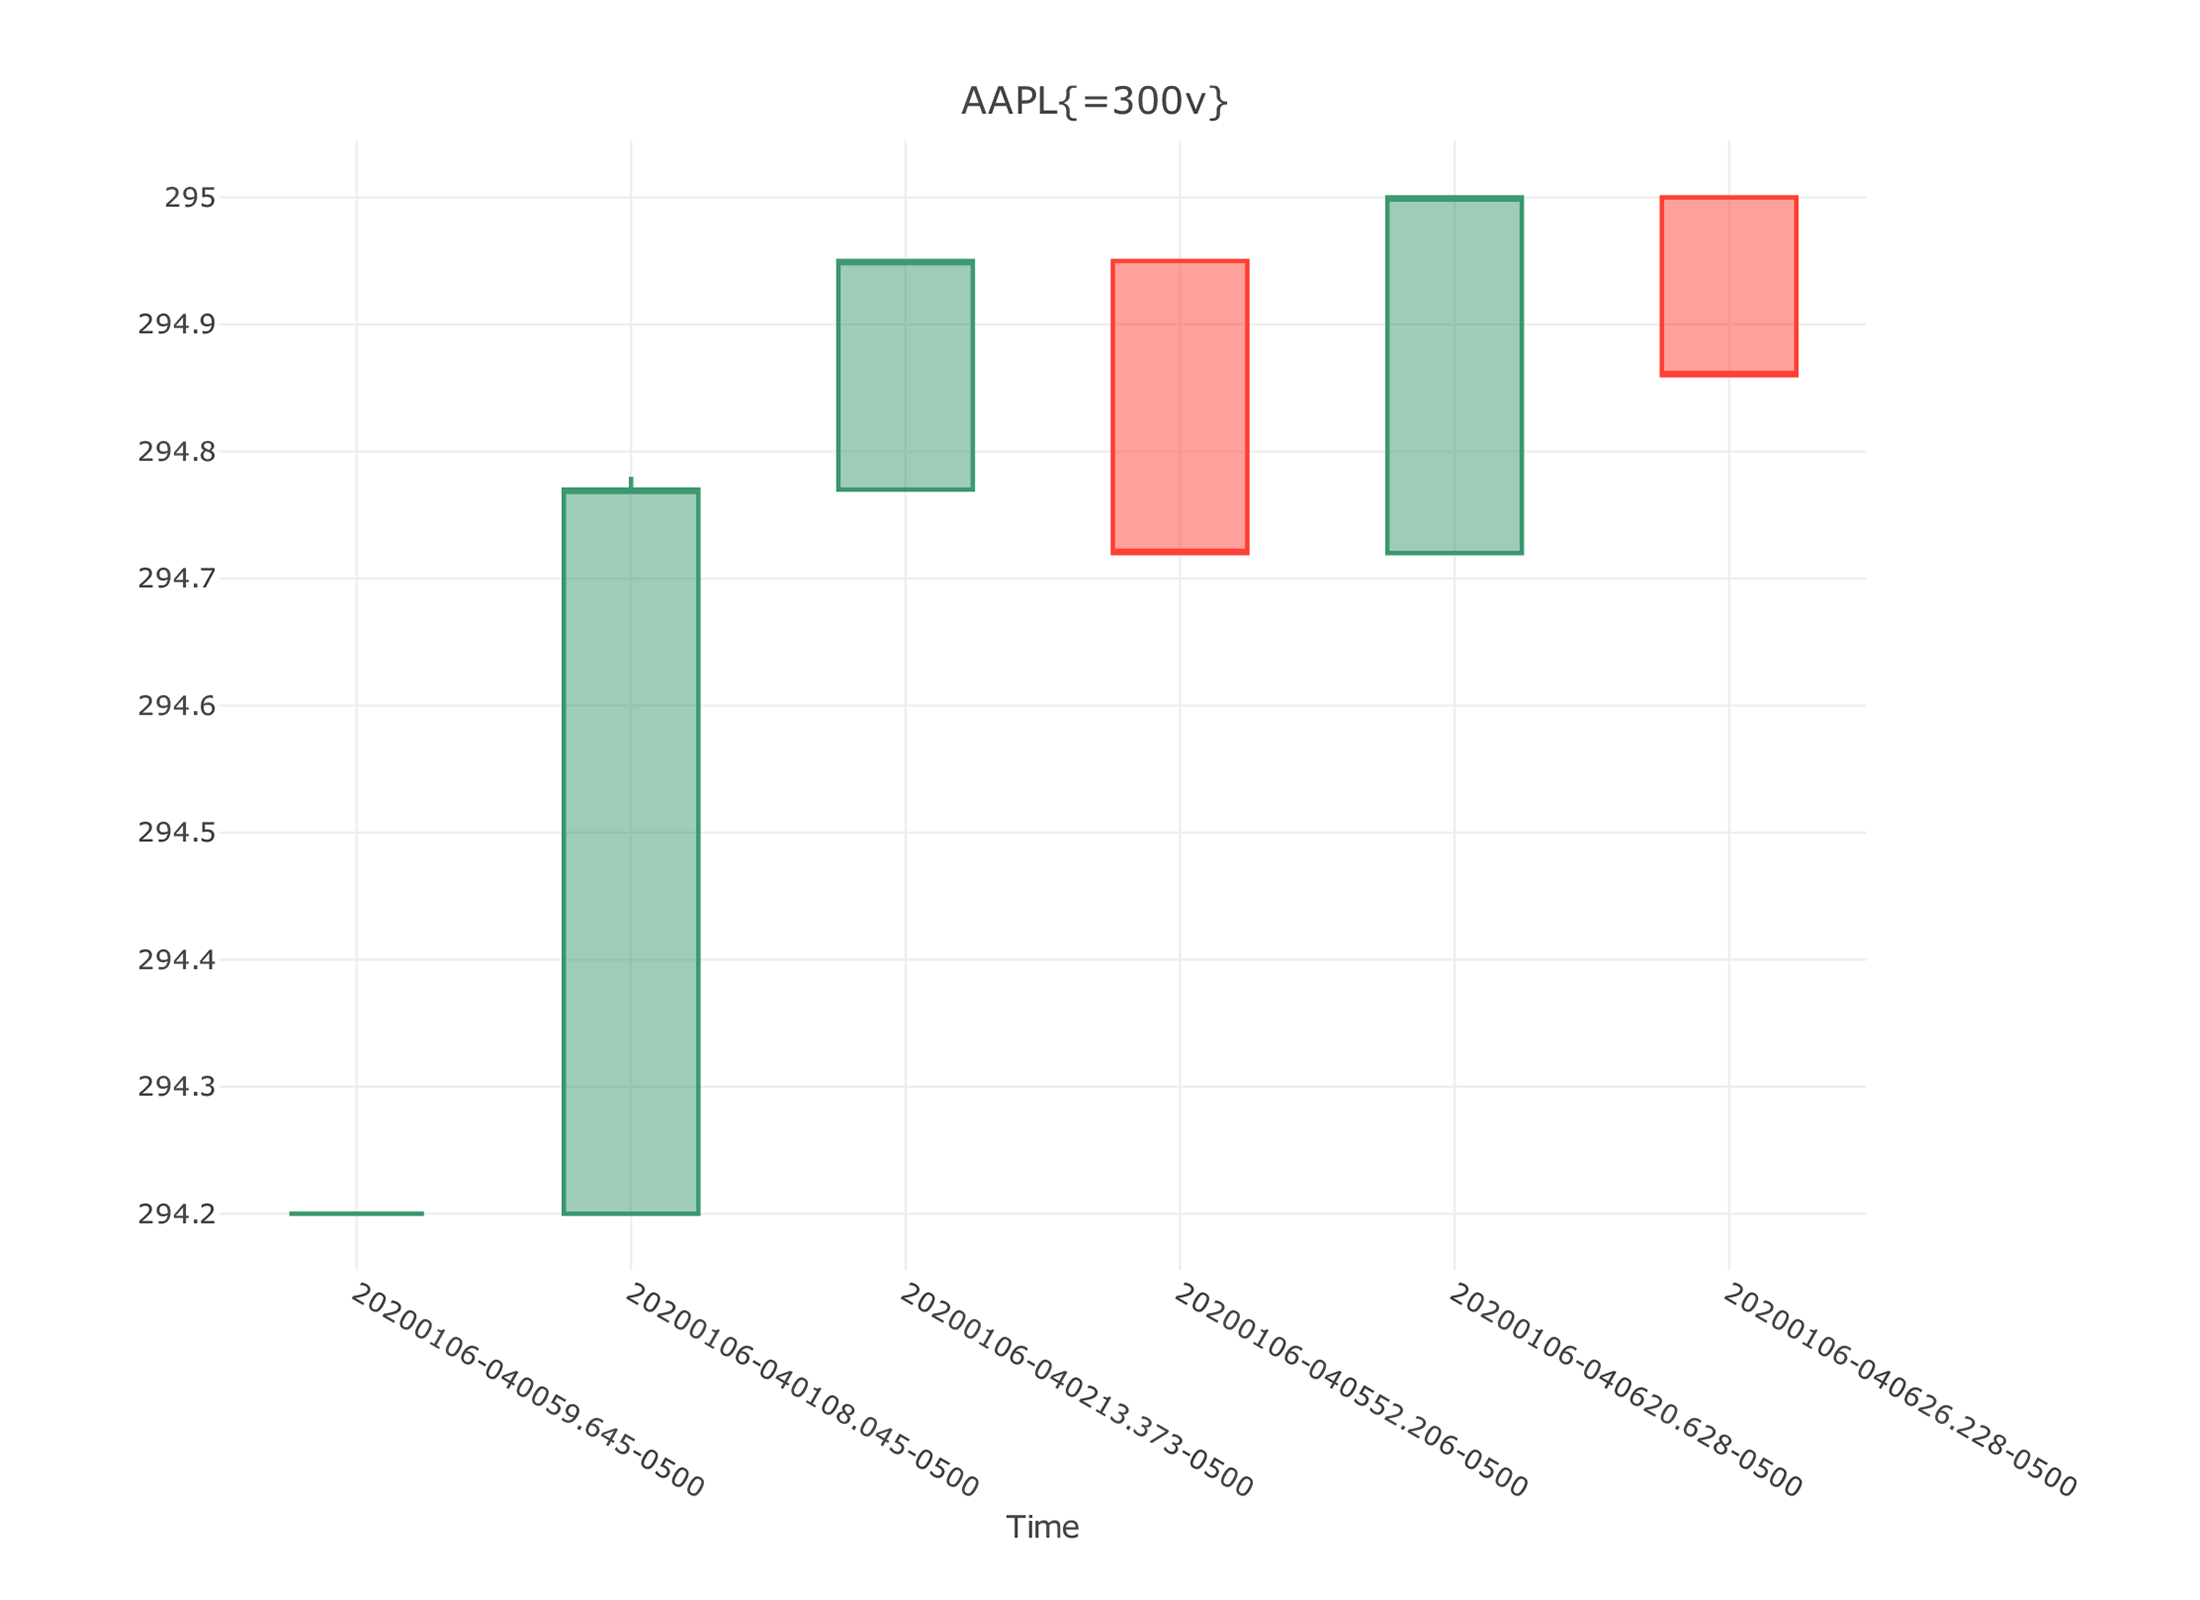 |
Price-based candles
To receive Price-based candles a user should add to the symbol the respective price change parameter {=0.1p}, ex. AAPL{=0.1p}, where 0.1 is a price change defined by the user.
Info
If price moves several times more than defined price change, then dxFeed Aggregated Data Service adds dummy candles with NaN volume and zero count that helps users to plot the chart easier.dxFeed Aggregated Data Service builds the price candles based on individual ticks
Example
If input ticks are:
Candle | EventSymbol | EventTime | Time | Sequence | Count | Open | High | Low | Close | Volume |
|---|---|---|---|---|---|---|---|---|---|---|
Candle | AAPL | 20200106-040059.645-0500 | 20200106-040059-0500 | 645:74 | 1 | 294.2 | 294.2 | 294.2 | 294.2 | 200 |
Candle | AAPL | 20200106-040108.045-0500 | 20200106-040108-0500 | 45:83 | 1 | 294.2 | 294.2 | 294.2 | 294.2 | 183 |
Candle | AAPL | 20200106-040200.774-0500 | 20200106-040200-0500 | 774:111 | 1 | 294.78 | 294.78 | 294.78 | 294.78 | 200 |
Candle | AAPL | 20200106-040213.373-0500 | 20200106-040213-0500 | 373:119 | 1 | 294.77 | 294.77 | 294.77 | 294.77 | 100 |
Candle | AAPL | 20200106-040531.686-0500 | 20200106-040531-0500 | 686:182 | 1 | 294.77 | 294.77 | 294.77 | 294.77 | 100 |
Candle | AAPL | 20200106-040531.942-0500 | 20200106-040531-0500 | 942:184 | 1 | 294.77 | 294.77 | 294.77 | 294.77 | 100 |
Candle | AAPL | 20200106-040552.206-0500 | 20200106-040552-0500 | 206:186 | 1 | 294.95 | 294.95 | 294.95 | 294.95 | 100 |
Candle | AAPL | 20200106-040552.206-0500 | 20200106-040552-0500 | 206:188 | 1 | 294.95 | 294.95 | 294.95 | 294.95 | 200 |
Candle | AAPL | 20200106-040620.628-0500 | 20200106-040620-0500 | 628:190 | 1 | 294.72 | 294.72 | 294.72 | 294.72 | 147 |
Candle | AAPL | 20200106-040621.029-0500 | 20200106-040621-0500 | 29:198 | 1 | 295 | 295 | 295 | 295 | 152 |
Candle | AAPL | 20200106-040626.228-0500 | 20200106-040626-0500 | 228:200 | 1 | 295 | 295 | 295 | 295 | 100 |
Candle | AAPL | 20200106-040626.593-0500 | 20200106-040626-0500 | 593:202 | 1 | 295 | 295 | 295 | 295 | 100 |
Then Price-based candles with 0.2 price change are:
Candle | EventSymbol | EventTime | Time | Sequence | Count | Open | High | Low | Close | Volume |
|---|---|---|---|---|---|---|---|---|---|---|
Candle | AAPL{=0.2p} | 20200106-040059.645-0500 | 20200106-040059-0500 | 645:74 | 2 | 294.2 | 294.4 | 294.2 | 294.4 | 383 |
Candle | AAPL{=0.2p} | 20200106-040200.774-0500 | 20200106-040200-0500 | 774:111 | 0 | 294.4 | 294.6 | 294.4 | 294.6 | NaN |
Candle | AAPL{=0.2p} | 20200106-040200.774-0500 | 20200106-040200-0500 | 774:112 | 4 | 294.6 | 294.8 | 294.6 | 294.8 | 500 |
Candle | AAPL{=0.2p} | 20200106-040552.206-0500 | 20200106-040552-0500 | 206:186 | 2 | 294.8 | 294.95 | 294.75 | 294.75 | 300 |
Candle | AAPL{=0.2p} | 20200106-040620.628-0500 | 20200106-040620-0500 | 628:190 | 1 | 294.75 | 294.92 | 294.72 | 294.92 | 147 |
Candle | AAPL{=0.2p} | 20200106-040621.029-0500 | 20200106-040621-0500 | 29:198 | 5 | 294.92 | 295 | 294.8 | 294.8 | 704 |
Price Level candles
To receive Price level candles for 5 minute aggregates, add the price change parameter {=5m,pl=0.3} to the symbol, ex. AAPL{=5m,pl=0.03}, where 5m stands for 5 minute original aggregate and 0.3 is a price level which should be shown.
Info
dxFeed Aggregated Data Service builds the price level candles based on individual ticks.
Example
If input ticks are:
Candle | EventSymbol | EventTime | Time | Sequence | Count | Open | High | Low | Close | Volume |
|---|---|---|---|---|---|---|---|---|---|---|
Candle | AAPL | 20200106-040200.774-0500 | 20200106-040200-0500 | 774:111 | 1 | 294.78 | 294.78 | 294.78 | 294.78 | 200 |
Candle | AAPL | 20200106-040213.373-0500 | 20200106-040213-0500 | 373:119 | 1 | 294.77 | 294.77 | 294.77 | 294.77 | 100 |
Candle | AAPL | 20200106-040531.686-0500 | 20200106-040531-0500 | 686:182 | 1 | 294.77 | 294.77 | 294.77 | 294.77 | 100 |
Candle | AAPL | 20200106-040531.942-0500 | 20200106-040531-0500 | 942:184 | 1 | 294.77 | 294.77 | 294.77 | 294.77 | 100 |
Candle | AAPL | 20200106-040552.206-0500 | 20200106-040552-0500 | 206:186 | 1 | 294.95 | 294.95 | 294.95 | 294.95 | 100 |
Candle | AAPL | 20200106-040552.206-0500 | 20200106-040552-0500 | 206:188 | 1 | 294.95 | 294.95 | 294.95 | 294.95 | 200 |
Candle | AAPL | 20200106-040620.628-0500 | 20200106-040620-0500 | 628:190 | 1 | 294.72 | 294.72 | 294.72 | 294.72 | 147 |
Candle | AAPL | 20200106-040621.029-0500 | 20200106-040621-0500 | 29:198 | 1 | 295 | 295 | 295 | 295 | 152 |
Candle | AAPL | 20200106-040626.228-0500 | 20200106-040626-0500 | 228:200 | 1 | 295 | 295 | 295 | 295 | 100 |
Candle | AAPL | 20200106-040626.593-0500 | 20200106-040626-0500 | 593:202 | 1 | 295 | 295 | 295 | 295 | 100 |
Then Price level 2-minutes candles with 0.2 price change are:
Candle | EventSymbol | EventTime | Time | Sequence | Count | Open | High | Low | Close | Volume |
|---|---|---|---|---|---|---|---|---|---|---|
Candle | AAPL{=2m,pl=0.2} | 20200106-040200.000-0500 | 20200106-040200-0500 | 1 | 2 | 294.78 | 294.78 | 294.77 | 294.77 | 300 |
Candle | AAPL{=2m,pl=0.2} | 20200106-040400.000-0500 | 20200106-040400-0500 | 1 | 2 | 294.77 | 294.77 | 294.77 | 294.77 | 200 |
Candle | AAPL{=2m,pl=0.2} | 20200106-040400.000-0500 | 20200106-040400-0500 | 2 | 2 | 294.95 | 294.95 | 294.95 | 294.95 | 300 |
Candle | AAPL{=2m,pl=0.2} | 20200106-040600.000-0500 | 20200106-040600-0500 | 1 | 1 | 294.72 | 294.72 | 294.72 | 294.72 | 147 |
Candle | AAPL{=2m,pl=0.2} | 20200106-040600.000-0500 | 20200106-040600-0500 | 3 | 3 | 295 | 295 | 295 | 295 | 352 |
Candle | AAPL{=2m,pl=0.2} | 20200106-040800.000-0500 | 20200106-040800-0500 | 2 | 2 | 294.86 | 294.97 | 294.86 | 294.97 | 352 |
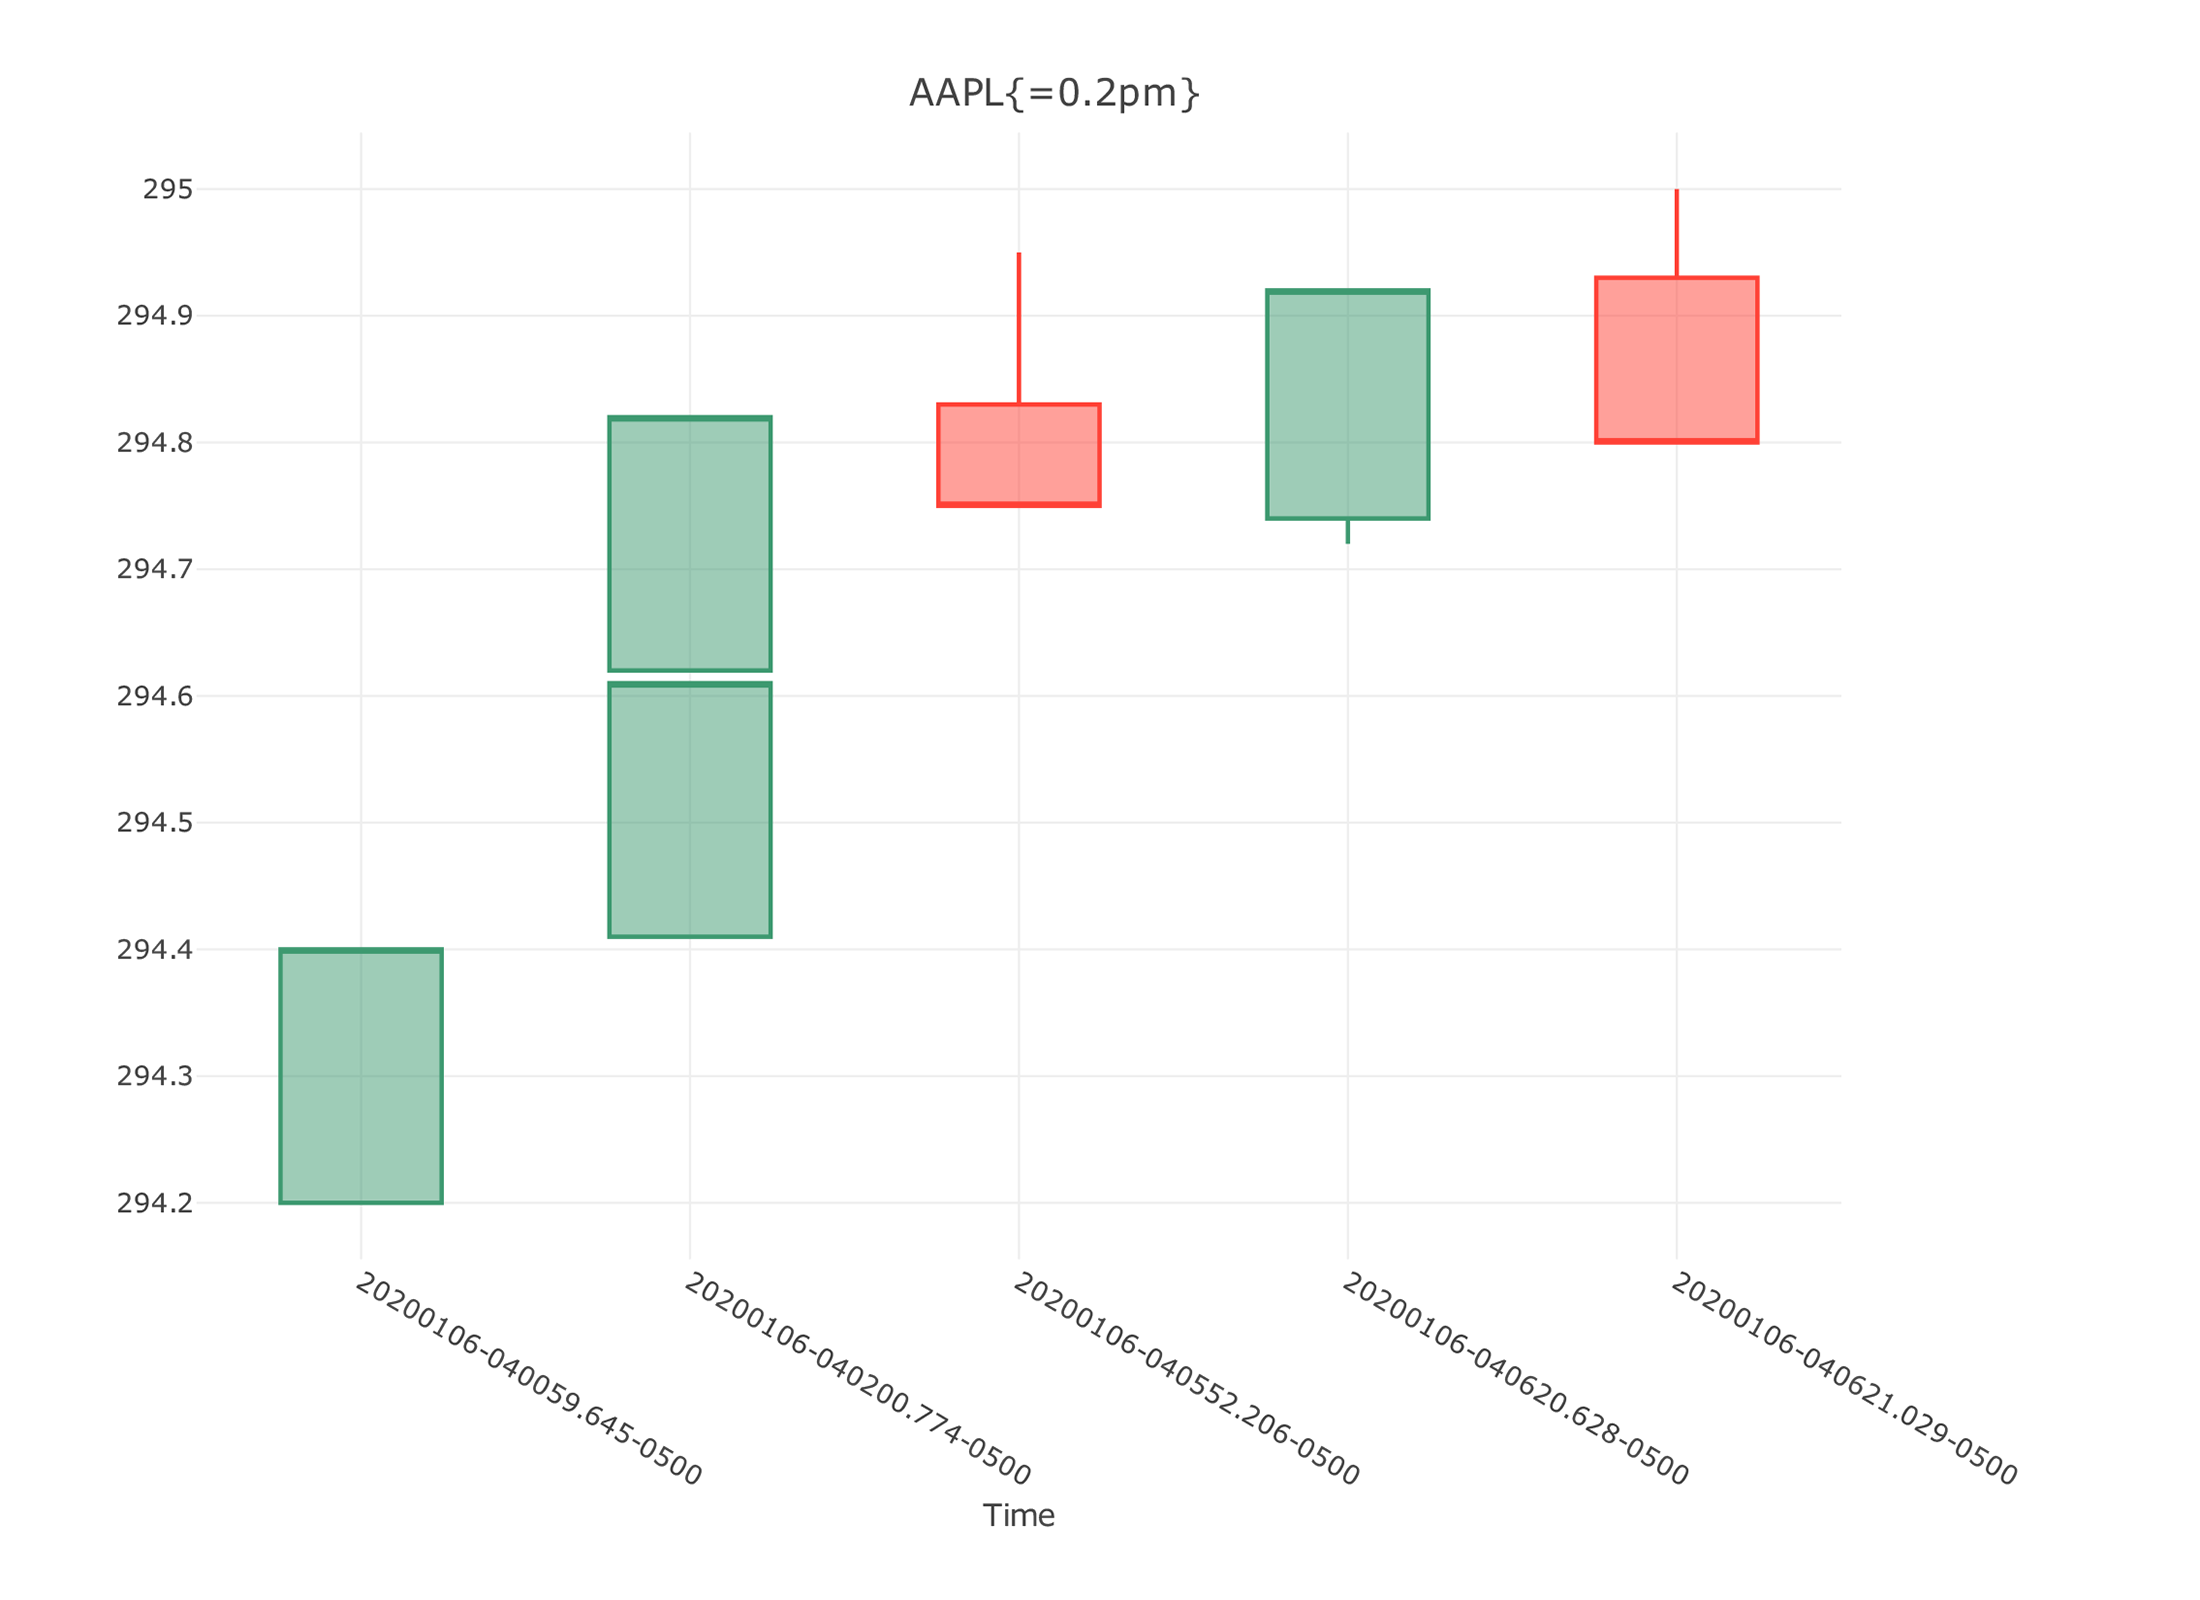
Price Momentum candles
To receive price momentum candles, define the price movement which should be used for candle construction, ex. AAPL{=0.1pm}.
Info
If price moves are several times larger than defined price change, then dxFeed Aggregated Data Service adds dummy candles with NaN volume and zero count that helps to plot the chart easier. dxFeed Aggregated Data Service builds the price momentum candles based on individual ticks.
Example
If input ticks are:
Candle | EventSymbol | EventTime | Time | Sequence | Count | Open | High | Low | Close | Volume |
|---|---|---|---|---|---|---|---|---|---|---|
Candle | AAPL | 20200106-040200.774-0500 | 20200106-040200-0500 | 774:111 | 1 | 294.78 | 294.78 | 294.78 | 294.78 | 200 |
Candle | AAPL | 20200106-040213.373-0500 | 20200106-040213-0500 | 373:119 | 1 | 294.77 | 294.77 | 294.77 | 294.77 | 100 |
Candle | AAPL | 20200106-040531.686-0500 | 20200106-040531-0500 | 686:182 | 1 | 294.77 | 294.77 | 294.77 | 294.77 | 100 |
Candle | AAPL | 20200106-040531.942-0500 | 20200106-040531-0500 | 942:184 | 1 | 294.77 | 294.77 | 294.77 | 294.77 | 100 |
Candle | AAPL | 20200106-040552.206-0500 | 20200106-040552-0500 | 206:186 | 1 | 294.95 | 294.95 | 294.95 | 294.95 | 100 |
Candle | AAPL | 20200106-040552.206-0500 | 20200106-040552-0500 | 206:188 | 1 | 294.95 | 294.95 | 294.95 | 294.95 | 200 |
Candle | AAPL | 20200106-040620.628-0500 | 20200106-040620-0500 | 628:190 | 1 | 294.72 | 294.72 | 294.72 | 294.72 | 147 |
Candle | AAPL | 20200106-040621.029-0500 | 20200106-040621-0500 | 29:198 | 1 | 295 | 295 | 295 | 295 | 152 |
Candle | AAPL | 20200106-040626.228-0500 | 20200106-040626-0500 | 228:200 | 1 | 295 | 295 | 295 | 295 | 100 |
Candle | AAPL | 20200106-040626.593-0500 | 20200106-040626-0500 | 593:202 | 1 | 295 | 295 | 295 | 295 | 100 |
Then Price momentum 2 minutes candles with 0.2 price change are:
Candle | EventSymbol | EventTime | Time | Sequence | Count | Open | High | Low | Close | Volume |
|---|---|---|---|---|---|---|---|---|---|---|
Candle | AAPL{=0.2pm} | 20200106-040059.645-0500 | 20200106-040059-0500 | 645:74 | 2 | 294.2 | 294.4 | 294.2 | 294.4 | 383 |
Candle | AAPL{=0.2pm} | 20200106-040200.774-0500 | 20200106-040200-0500 | 774:111 | 0 | 294.41 | 294.61 | 294.41 | 294.61 | NaN |
Candle | AAPL{=0.2pm} | 20200106-040200.774-0500 | 20200106-040200-0500 | 774:112 | 4 | 294.62 | 294.82 | 294.62 | 294.82 | 500 |
Candle | AAPL{=0.2pm} | 20200106-040552.206-0500 | 20200106-040552-0500 | 206:186 | 2 | 294.83 | 294.95 | 294.75 | 294.75 | 300 |
Candle | AAPL{=0.2pm} | 20200106-040620.628-0500 | 20200106-040620-0500 | 628:190 | 1 | 294.74 | 294.92 | 294.72 | 294.92 | 147 |
Candle | AAPL{=0.2pm} | 20200106-040621.029-0500 | 20200106-040621-0500 | 29:198 | 5 | 294.93 | 295 | 294.8 | 294.8 | 704 |
 |
Renko candles
To receive Renko candles, add {=0.1pr}, ex. AAPL{=0.1pr} to the symbol, where 0.1 is a preferred Renko box size.
Info
If price moves are larger than defined in the box size parameter, then dxFeed Aggregated Data Service adds dummy candles with NaN volume and zero count that helps users to plot Ranko candles easier. dxFeed always builds Renko candles based on minute candles (this parameter is not configurable).
Example
If input minute candles are:
Candle | EventSymbol | EventTime | Time | Sequence | Count | Open | High | Low | Close | Volume |
|---|---|---|---|---|---|---|---|---|---|---|
Candle | AAPL{=m} | 20200106-040100.0000500 | 20200106-040100-0500 | 0 | 1 | 294.2 | 294.2 | 294.2 | 294.2 | 183 |
Candle | AAPL{=m} | 20200106-040200.0000500 | 20200106-040200-0500 | 0 | 2 | 294.78 | 294.78 | 294.77 | 294.77 | 300 |
Candle | AAPL{=m} | 20200106-040500.0000500 | 20200106-040500-0500 | 0 | 4 | 294.77 | 294.95 | 294.77 | 294.95 | 500 |
Candle | AAPL{=m} | 20200106-040600.0000500 | 20200106-040600-0500 | 0 | 4 | 294.72 | 295 | 294.72 | 295 | 499 |
Then Renko candles are:
Candle | EventSymbol | EventTime | Time | Sequence | Count | Open | High | Low | Close | Volume |
|---|---|---|---|---|---|---|---|---|---|---|
Candle | AAPL{=0.2pr} | 20200106-040100.000-0500 | 20200106-040100-0500 | 0 | 1 | 294.2 | 294.4 | 294.2 | 294.4 | 183 |
Candle | AAPL{=0.2pr} | 20200106-040200.000-0500 | 20200106-040200-0500 | 0 | 0 | 294.4 | 294.6 | 294.4 | 294.6 | NaN |
Candle | AAPL{=0.2pr} | 20200106-040200.000-0500 | 20200106-040200-0500 | 1 | 1 | 294.6 | 294.8 | 294.6 | 294.8 | 300 |
Candle | AAPL{=0.2pr} | 20200106-040500.000-0500 | 20200106-040500-0500 | 0 | 2 | 294.8 | 295 | 294.8 | 295 | 999 |
Option expiration candles
To receive option specific candles, define how many standard option periods should be aggregated together, ex. .AAPL200207C225{=2o} - 2 weeks will be aggregated together.
Info
Option-aggregated charts are built based on daily candles.
The standard intervals are defined the following way according to dxFeed reference data:
For daily options - interval is a day
For weekly options - interval is a week (from Monday to Sunday)
For monthly options - interval is a month from the 1st day to the last day of the month
For quarterly options - interval is a quarter from the 1st day of the quarter to the last day
For all other options - interval is a month which starts from the 3rd Saturday of the month and end at 3rd Friday of the next month
Example
If input ticks are:
Candle | EventSymbol | Time | Sequence | Count | Open | High | Low | Close | Volume |
|---|---|---|---|---|---|---|---|---|---|
Candle | .AAPL200207C280{=d} | 20191226-010000+0100 | 0 | 8 | 15.34 | 16 | 15 | 16 | 117 |
Candle | .AAPL200207P280{=d} | 20191226-010000+0100 | 0 | 10 | 6.45 | 6.7 | 6.3 | 6.45 | 28 |
Candle | .AAPL200207C280{=d} | 20191227-010000+0100 | 0 | 5 | 18.6 | 19.8 | 16.77 | 16.77 | 20 |
Candle | .AAPL200207P280{=d} | 20191227-010000+0100 | 0 | 30 | 5.85 | 6.95 | 5.35 | 6.73 | 52 |
Candle | .AAPL200207C280{=d} | 20191230-010000+0100 | 0 | 6 | 14.77 | 18.35 | 14.6 | 18.35 | 17 |
Candle | .AAPL200207P280{=d} | 20191230-010000+0100 | 0 | 31 | 7.3 | 8.04 | 5.85 | 6.15 | 65 |
Candle | .AAPL200207C280{=d} | 20191231-010000+0100 | 0 | 1 | 18.18 | 18.18 | 18.18 | 18.18 | 1 |
Candle | .AAPL200207P280{=d} | 20191231-010000+0100 | 0 | 16 | 6.22 | 6.22 | 5.59 | 5.6 | 28 |
Candle | .AAPL200207C280{=d} | 20200102-010000+0100 | 0 | 5 | 20.55 | 24.15 | 20.55 | 24.15 | 31 |
Candle | .AAPL200207P280{=d} | 20200102-010000+0100 | 0 | 36 | 4.64 | 4.74 | 4.1 | 4.1 | 120 |
Candle | .AAPL200207C280{=d} | 20200103-010000+0100 | 0 | 9 | 24.2 | 24.29 | 22.5 | 22.5 | 23 |
Candle | .AAPL200207P280{=d} | 20200103-010000+0100 | 0 | 33 | 4.2 | 4.7 | 4.1 | 4.43 | 65 |
Candle | .AAPL200207C280{=d} | 20200106-010000+0100 | 0 | 7 | 20.35 | 23.33 | 20.35 | 23.33 | 78 |
Candle | .AAPL200207P280{=d} | 20200106-010000+0100 | 0 | 46 | 5.5 | 5.95 | 3.65 | 3.65 | 222 |
Candle | .AAPL200207C280{=d} | 20200107-010000+0100 | 0 | 5 | 23.35 | 23.55 | 23.13 | 23.13 | 11 |
Candle | .AAPL200207P280{=d} | 20200107-010000+0100 | 0 | 26 | 3.45 | 4.07 | 3.35 | 3.5 | 101 |
Then option expiration candles for this set are:
Candle | EventSymbol | Time | Sequence | Count | Open | High | Low | Close | Volume |
|---|---|---|---|---|---|---|---|---|---|
Candle | .AAPL200207C280{=o} | 20191223-010000+0100 | 0 | 13 | 15.34 | 19.8 | 15 | 16.77 | 137 |
Candle | .AAPL200207C280{=o} | 20191230-010000+0100 | 0 | 21 | 14.77 | 24.29 | 14.6 | 22.5 | 72 |
Candle | .AAPL200207C280{=o} | 20200106-010000+0100 | 0 | 12 | 20.35 | 23.55 | 20.35 | 23.13 | 89 |
Formula-based candles
To receive formula-based candles, specify the formula and time period. For example, =(AAPL+GOOG)/2{=1d} will return daily candles where the properties of the candle were calculated from AAPL and GOOG daily candles values.
Example
If input ticks are:
==HISTORY_DATA
=Candle	EventSymbol EventTime Time Sequence Count Open High Low	Close Volume VWAP BidVolume AskVolume ImpVolatility OpenInterest
Candle	=AAPL{=d}	20220501-190000.000-0500	20220501-190000-0500	0	0	156.71	158.23	153.27	157.96	NaN	NaN	NaN	NaN	NaN	NaN	EventFlags=SNAPSHOT_BEGIN
Candle	GOOG{=d}	20220501-190000.000-0500	20220501-190000-0500	0	3416	2278.13	2346.79	2267.99	2343.14	1513982	2313.51806305542	398051	264453	0.4007	0	EventFlags=SNAPSHOT_BEGIN
Candle	=AAPL{=d}	20220502-190000.000-0500	20220502-190000-0500	0	0	158.15	160.71	156.32	159.48	NaN	NaN	NaN	NaN	NaN	NaN
Candle	GOOG{=d}	20220502-190000.000-0500	20220502-190000-0500	0	2391	2335.3	2386	2332.54	2362.59	1060787	2361.21985616493	323156	125062	0.3828	0
Candle	=AAPL{=d}	20220503-190000.000-0500	20220503-190000-0500	0	0	159.67	166.48	159.26	166.02	NaN	NaN	NaN	NaN	NaN	NaN
Candle	GOOG{=d}	20220503-190000.000-0500	20220503-190000-0500	0	4152	2360.07	2462.86	2314.77	2451.5	1661573	2390.91673195041	455598	247315	0.3463	0
Candle	=AAPL{=d}	20220504-190000.000-0500	20220504-190000-0500	0	0	163.85	164.08	154.95	156.77	NaN	NaN	NaN	NaN	NaN	NaN	EventFlags=SNAPSHOT_END
Candle	GOOG{=d}	20220504-190000.000-0500	20220504-190000-0500	0	5445	2404.41	2424.665	2303.65	2334.93	2154452	2340.89974398255	608454	344215	0.4247	0	EventFlags=SNAPSHOT_END
Then output is:
==HISTORY_DATA
=Candle	EventSymbol EventTime Time Sequence Count Open High Low	Close Volume VWAP BidVolume AskVolume ImpVolatility OpenInterest
Candle	=(AAPL+GOOG)/2{=d}	20220501-190000.000-0500	20220501-190000-0500	0	0	1217.42	1252.51	1210.63	1250.55	NaN	NaN	NaN	NaN	NaN	NaN	EventFlags=SNAPSHOT_BEGIN
Candle	=(AAPL+GOOG)/2{=d}	20220502-190000.000-0500	20220502-190000-0500	0	0	1246.725	1273.355	1244.43	1261.035	NaN	NaN	NaN	NaN	NaN	NaN
Candle	=(AAPL+GOOG)/2{=d}	20220503-190000.000-0500	20220503-190000-0500	0	0	1259.87	1314.67	1237.015	1308.76	NaN	NaN	NaN	NaN	NaN	NaN
Candle	=(AAPL+GOOG)/2{=d}	20220504-190000.000-0500	20220504-190000-0500	0	0	1284.13	1294.3725	1229.3	1245.85	NaN	NaN	NaN	NaN	NaN	NaN	EventFlags=SNAPSHOT_END