Options Scanner
Overview
dxFeedRadar Options Scanner is a powerful SaaS platform that enables real-time scanning of the entire equities and options universe using a wide variety of criteria. The Options Scanner solves some of the financial industry’s most challenging questions:
How to find the right investment instruments
How to get real-time trading triggers
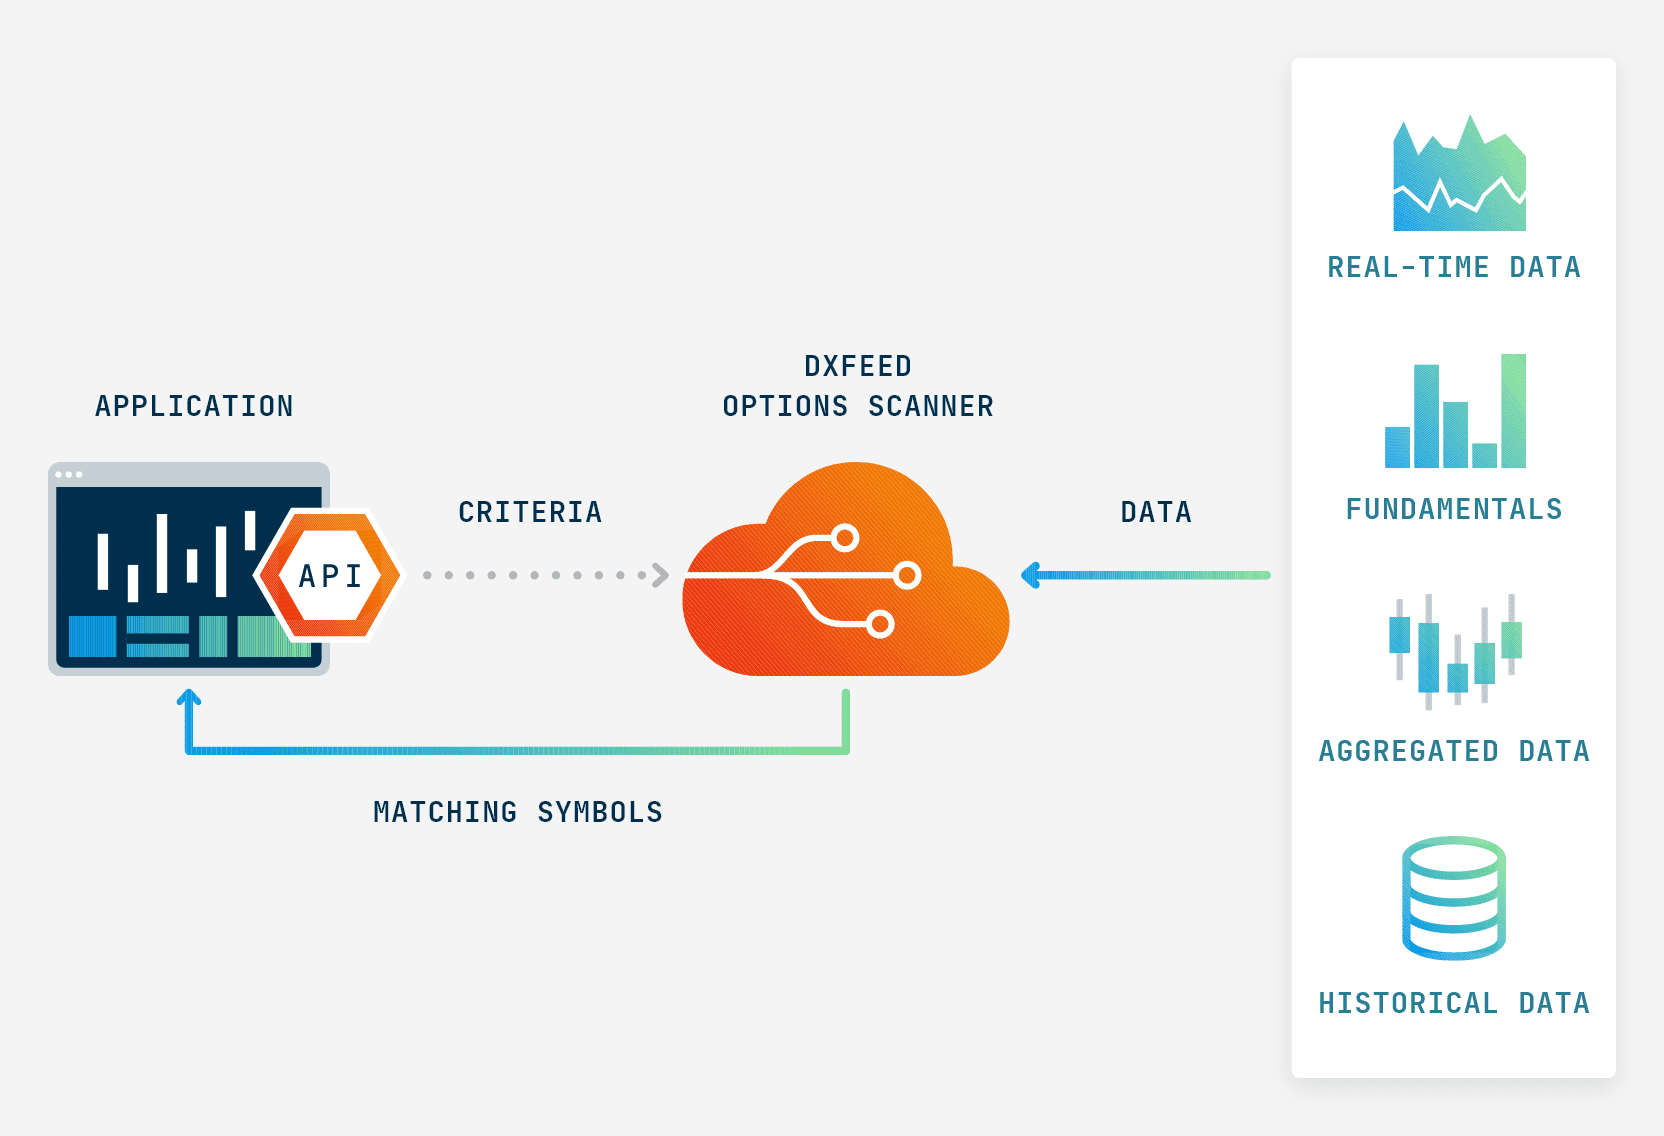
dxFeed Options Scanner can be connected to your application or website using REST API. Searches are performed in tick resolution using real-time data from all major US and European exchanges. An extensive range of options parameters (e.g., Greeks, IV, and theoretical option prices) and underlying fundamentals can be used for searching. Clients are provided with the powerful dxScript language to build their own search criteria.
Benefits
A powerful SaaS platform that enables instrument searches via seamless REST API integration
Unbeatable coverage, supporting 2mln+ instruments: the entire universe of US and European equities and options
An extensive set of pre-built data points, including theoretical options pricing, Greeks and IV calculation, VIX and ATM IV
Unique dxScript programming language for time series analysis to set more targeted criteria
Low latency data feeds through dxFeed residing in the closest proximity to exchanges
Consulting & expertise
24x7 Support
How it works
Features
Main features of dxFeed OptionsScanner:
150+ supported data points
100+ supported requests per minute, each scanning 2mln+ instruments, equities, and options to find a match. Horizontally scalable for more
Leverages all dxFeed OPRA feed capabilities and the dxFeed infrastructure to deliver relevant and the most accurate search result possible
The Options Scanner makes it possible to use all the data for filtering, sorting, and fetching actual values. The data can also be used to create custom market expressions (e.g., ratios or differences), and they can be used anywhere else in the request.
Data available in the OptionsScanner:
Options descriptive data
Symbol, underlying, CFI, expiration, strike price
Theoretical prices
Model-free approach to receive theoretical options prices that:
Enter into the existing bid/ask if possible
Are arb-free
Are extrapolated when no quotes exist
Greeks and implied volatility
Calculated using the Black-Scholes model
Aggregated data
Latest daily candles
Historical indicators
Average volumes, prices, historical volatilities, technical indicators
Aggregations of options data on the underlying level
Сall, Put, total volume, and open interest. VIX and ATM implied volatility, calculated for an option series closest to the required residual maturity
Maturity curves on the underlying level
Time value, strike moneyness per option, implied volatility by time to expiration
All data available for underlyings
Fundamentals, Prices & Candles, Quotes, and more
Use case: option strategy based on IV to SV ratio
Description
In modern financial markets, it is becoming increasingly difficult to keep up with the flow of information. The right set of tools is often the key to understanding what’s important and what’s not. This is especially true in the case of option markets where the number of outstanding contracts is enormous.
Here we examine one possible scenario of options analysis using dxFeed Options Scanner.
The ratio of implied (IV) and statistical (SV) volatility of the underlying security measures the relation between the theoretical and the market price of the option. A high ratio indicates the option is overpriced (e.g, investors treat the asset as a hedge) and vice versa (e.g., insufficient liquidity).
If the ratio is sufficiently high, (e.g., greater than 1.3), it is a possible sign that option-selling strategies are viable. There’s a range of applicable approaches, such as selling the naked or covered option, or shorting the straddle (a combination of a call and put), to name a few. While the choice of a particular strategy is up to each trader’s style and risk preference, dxFeed Options Scanner allows them to quickly highlight cases for further analysis. We would also like to narrow our search down to the options near the money, with a strike price between 0.95 and 1.05 of the latest available price of the underlying security.
Using dxFeed Options Scanner
Choose the options data points to receive:
price
symbol
Select the data points that will be used to find options you are interested in:
underlying.atmIv60Day = the implied volatility of an ATM option with a residual maturity of 60 days
underlying.statVol2Month = the annualized historical standard deviation of logarithmic returns, calculated based on 2 calendar months
strikeMoneyness = the ratio between the options strike and the latest available price of its underlying security
dayVolume = current day volume of the instrument
callput, Call or Put
To get the ratio between ATM IV and SV, create a new mathematical expression:
ratio: underlying.atmIv60Day / underlying.statVol2Month
Add filters to the desired attributes. In this case, we are interested in near the money call options with sufficient trading volume and a high IV to SV ratio:
a ratio greater than 1.3
strikeMoneyness between 0.95 and 1.05
dayVolume greater than 1000
callput equals (call)
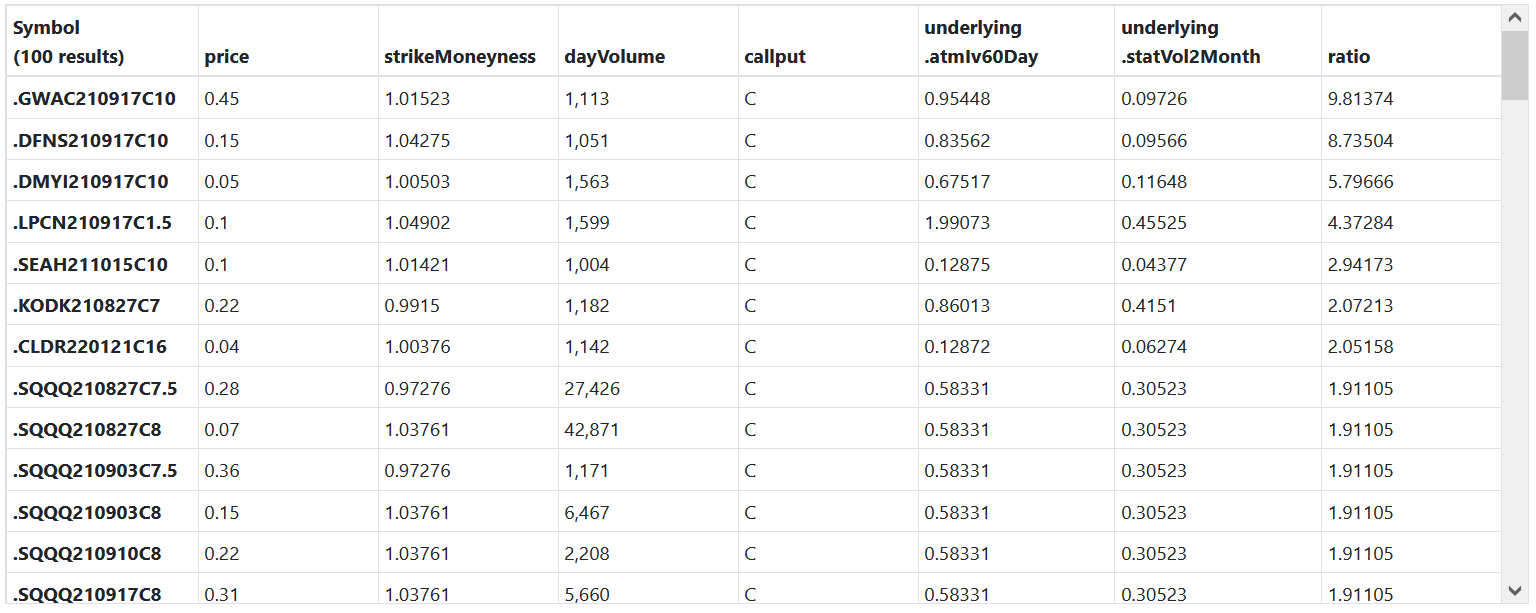
The results will be returned with the data for selected data points. For example, the result might be presented as follows:
Request
The actual API request will look like:
{
    "instrumentCategory": "OPTION",
    "datapoints": [
        {
            "expr": "callput"
        },
        {
            "expr": "price"
        },
        {
            "expr": "dayVolume"
        },
        {
            "expr": "strikeMoneyness"
        },
        {
            "expr": "underlying.atmIv60Day"
        },
        {
            "expr": "underlying.statVol2Month"
        },
        {
            "expr": "underlying.atmIv60Day / underlying.statVol2Month",
			"name": "ratio"
        }
    ],
    "filters": [
        {
            "datapoint": 0,
            "alternatives": [
                {
                    "predicate": "==",
                    "args": [
                        "C"
                    ]
                }
            ]
        },
        {
            "datapoint": 2,
            "alternatives": [
                {
                    "predicate": ">",
                    "args": [
                        "1000"
                    ]
                }
            ]
        },
        {
            "datapoint": 3,
            "alternatives": [
                {
                    "predicate": "[]",
                    "args": [
                        "0.95",
                        "1.05"
                    ]
                }
            ]
        },
        {
            "datapoint": 6,
            "alternatives": [
                {
                    "predicate": ">",
                    "args": [
                        "1.3"
                    ]
                }
            ]
        }
    ],
    "sorters": [
        {
            "datapoint": 6
        }
    ],
    "outputs": [
        {
            "datapoint": 0
        },
        {
            "datapoint": 1
        },
        {
            "datapoint": 2
        },
		{
            "datapoint": 3
        },
        {
            "datapoint": 4
        },
        {
            "datapoint": 5
        },
        {
            "datapoint": 6
        }
    ]
}